Índice
The data war has begun.
A few weeks ago we woke up to the news that Microsoft has launched its web analytics platform: Clarity. It also offers us a service of user recordings and heat maps with unlimited sessions.
We have already implemented it for all our clients in order to improve the web experience of the users of the different webs. In terms of web analysis and user behavior, the new Microsoft tool, called Clarity, does not provide much information. For now we have to settle for a series of dashboards predefined by the platform itself and the recordings of users and heat maps. Therefore, we recommend that you use this tool together with the Google Analytics metrics.
How to create the Microsoft Clarity account and how to install it on the web
Creating an MCC account in Clarity is very simple, you just have to go to the url of the landing page: https://clarity.microsoft.com/
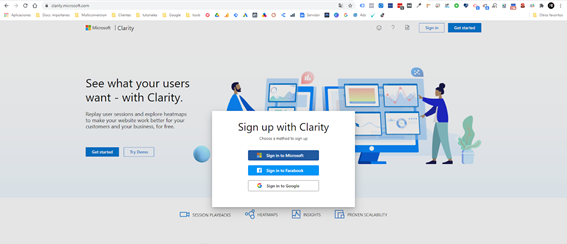
Once inside the landing page, all you have to do is 2 simple steps, click the “get started” button and log in with an Outlook, Gmail or Facebook account. When you log in, the account is automatically created where you can host all the projects you have in hand.
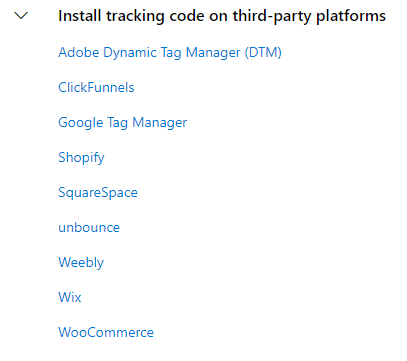
After that, what you will have to do is install the tracking pixel. For this Microsoft offers us different options. We can copy the code in the “head” of our website. We also use some of the third party add-ons that they offer such as: Google Tag Manager, Shopify, woocomerce, etc. Here we leave you an image with all the options:
We have chosen to insert this code through tag manager, for that you only have to copy the piece of HTML code that the platform gives you and create an HTML tag that is activated in all the pages of your website.
In addition to this, the platform also lets you connect your Google Analytics account to be able to obtain more data for dashboards.
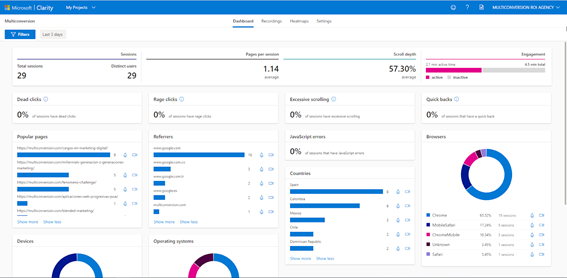
What information do dashborads offer?
As you have already seen in the example above, the graphs that are predefined by the platform show you data. For example: number of sessions, pages by sessions, scroll length, engagement, dead clicks, popular pages, referral sources, fast backward, the browsers, devices, operating systems, countries and JavaScript errors. All this information is very focused on improving the usability of the web.
From what we have observed so far with this tool you will not be able to analyze as much data as in Google Analytics, since you do not have any metrics for purchases, products and other metrics and deep dimensions that Google gives you. But it is a good tool to be aware of the operation of our website on all devices, operating systems and browsers.
Through dashborad you can access the recordings with the filters according to the dashboard for which you have been interested. For example, if you are reviewing the dead click graph, when you click on the graph, a link appears to go to review the recordings that have had these problems. And thus quickly detect on which pages your users are having problems and be able to correct them as soon as possible.
User recordings
Within this Microsoft tool you will be lucky enough to have an infinity of recordings of all the pages of your website. This together with the filters will make sure that you have controlled even the smallest detail of your website. Although, for now, we do not have tracked events such as purchases or submitted forms, we can use the advanced filters to see visits that during the session have browsed certain pages.
Another way to take advantage of this filtering would be to make a configuration to see all the users who have gone through the cart and through the checkout but who have not gone through the thank you for buying page. In this way, we can detect anomalies or usability failures in our online shopping process and to improve the conversion rate and conversions.
By default, this platform hides sensitive data such as telephone numbers, emails, user data, card numbers and prices. To be able to visualize this data in the recordings you will have to make extra configurations in the code of your website, for this we leave you the link to the official Microsoft documentation: https://docs.microsoft.com/en-us/clarity/clarity- masking
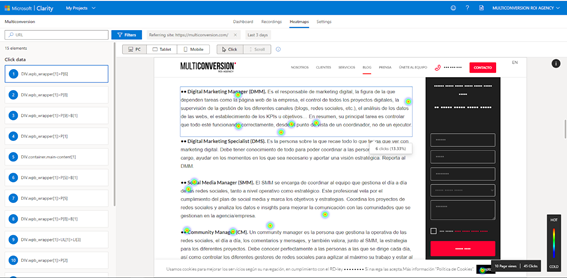
Clarity heat maps
In this section you will find something very similar to the previous view but this time what you are shown are the click and scroll heat maps. This can help you to detect which sites on each page users make the most clicks. And thus be able to discover those sites where users should not click and they do. Or sites where they do not understand that it is clickable. On the other hand, another analysis that you can take from this view is the Average fold. This means the part that is visible by the user as soon as they enter each page and how they interact in addition to being able to detect if you have to improve the visibility of any CTA of interest such as contact or purchase buttons.